The data used in this project was sourced from the USDA FoodData Central API, a reliable and comprehensive repository of food and nutrient data. The decision to use USDA's database stems from its authoritative and up-to-date information on food composition, making it an ideal choice for a health analytics project. By gathering data directly from the USDA, we ensure a high level of accuracy and relevance for analyzing the impact of ultra-processed foods on public health. Health analytics is essential for uncovering critical trends and making informed decisions about dietary habits, addressing global health crises such as obesity and chronic diseases.
How the Data Was Gathered
Data was collected using the USDA FoodData Central API, a trusted and comprehensive source of food and nutrition information. The USDA (United States Department of Agriculture) maintains an extensive repository of food composition data, making it a reliable resource for health and nutrition analytics. The USDA FoodData Central API provides access to various datasets, including nutrient profiles, food descriptions, and product categories.

For programmatic access, we used the **FoodData Central API**, which allows querying foods based on categories, brand names, and specific nutrient values. The core endpoint utilized for retrieving food data was:
Raw and Cleaned Data
Below are snapshots of the raw and cleaned data, providing an overview of the transformation process:
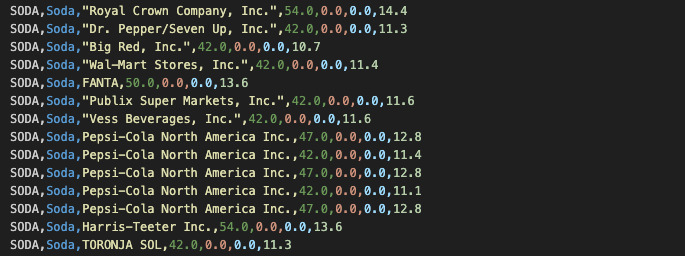
Raw Data
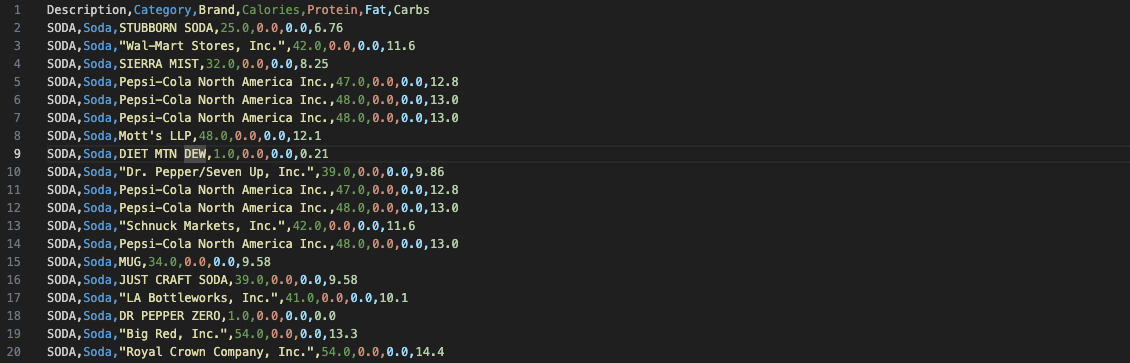
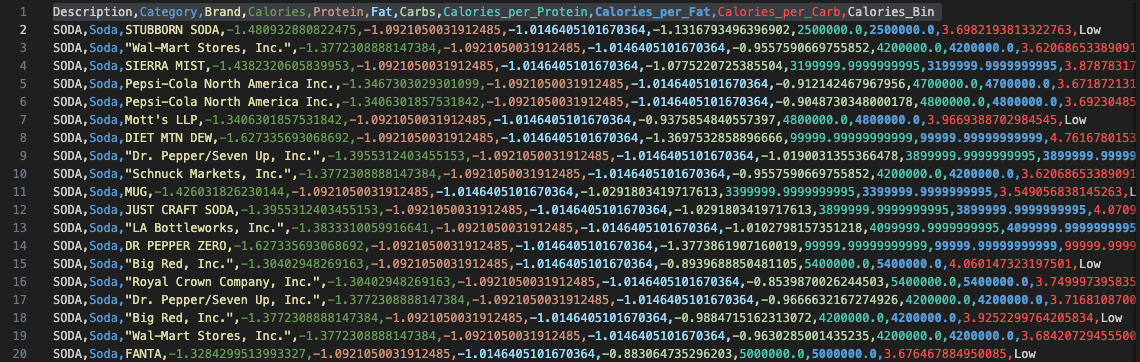
The raw data consists of a list of various soda brands along with their respective nutritional information. Each row represents a soda product and includes attributes such as brand name, manufacturer, calorie content, protein, fat, carbohydrates, and other key nutritional values. The data appears structured but contains redundant entries, missing values, and inconsistencies that need cleaning for effective analysis. This dataset serves as the foundation for understanding the composition of ultra-processed beverages and their impact on health.
Data Cleaning and Transformation Process
Before diving into the preprocessing steps, here is a snapshot of the raw, dirty data highlighting the challenges we addressed:
The raw data exhibited several issues, including missing values, duplicate rows, and extreme outliers. These challenges necessitated a robust data cleaning and transformation process to ensure data quality and reliability.
- Handling Missing Values: Missing values were replaced with default values to ensure completeness. Nutritional attributes were set to zero if missing, while categorical columns like 'Brand' and 'Category' were labeled as 'Unknown' or 'Uncategorized'.
- Removing Duplicates: Duplicate rows were detected and removed to prevent redundancy in the dataset.
- Outlier Removal: Statistical techniques (Interquartile Range - IQR) were applied to detect and remove extreme outliers in key numerical features such as 'Calories', 'Protein', 'Fat', and 'Carbs'.
- Feature Engineering: New meaningful features were created, such as:
- Calories per Protein, Calories per Fat, and Calories per Carb to analyze nutritional density.
- Calories Binning (Low, Medium, High, Very High) to categorize food items into calorie levels.
Visualization of Raw Data Issues
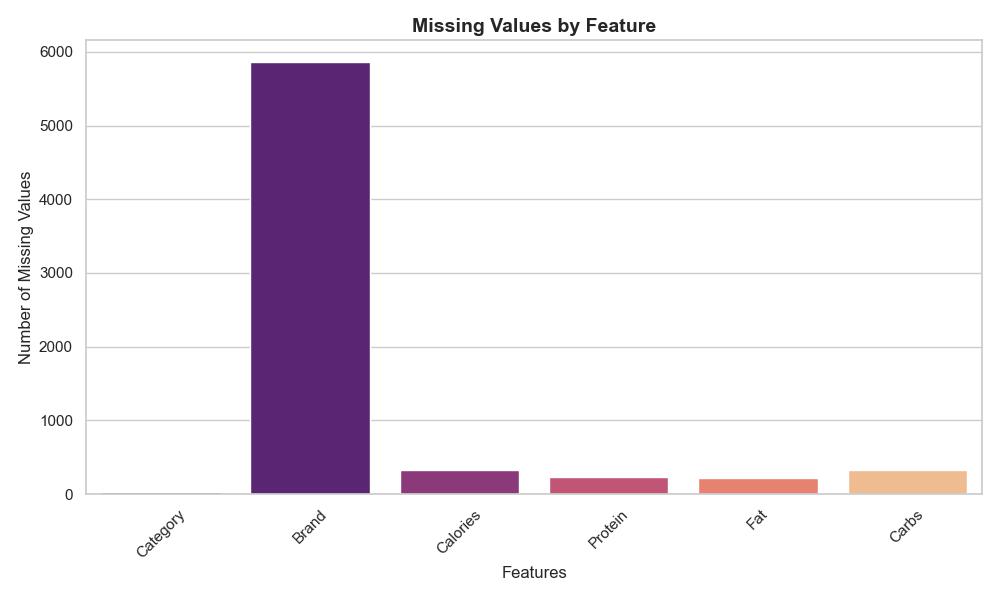
Missing Values by Feature
The bar chart below highlights the distribution of missing values across different features. The 'Brand' column had the most missing values, followed by nutritional attributes such as 'Calories', 'Protein', 'Fat', and 'Carbs'. Addressing these gaps was crucial to maintaining data integrity.
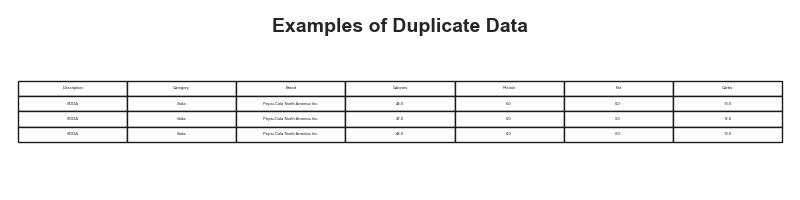
Examples of Duplicate Data
The table below showcases examples of duplicate rows found in the dataset. Duplicates can lead to biased analysis and inaccurate insights. These entries were identified and removed during the preprocessing stage to ensure a reliable dataset.
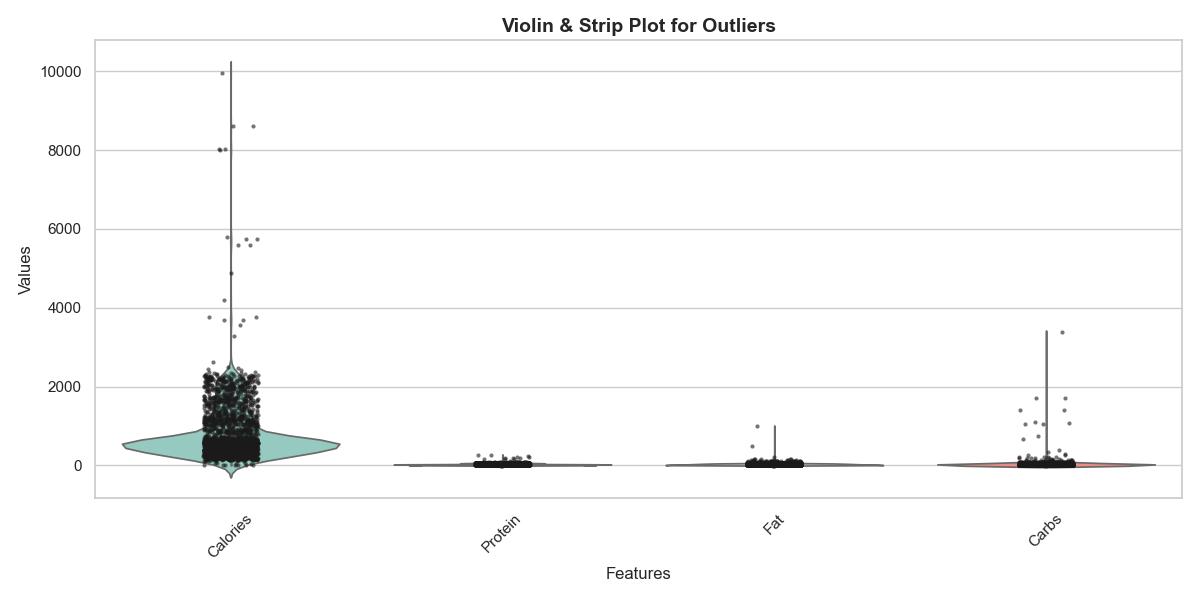
Violin & Strip Plot for Outliers
The visualization below utilizes a violin plot combined with a strip plot to showcase outliers in the dataset. The 'Calories' and 'Carbs' features exhibited the most extreme outliers. These were addressed using the Interquartile Range (IQR) method to enhance the quality of our data analysis.
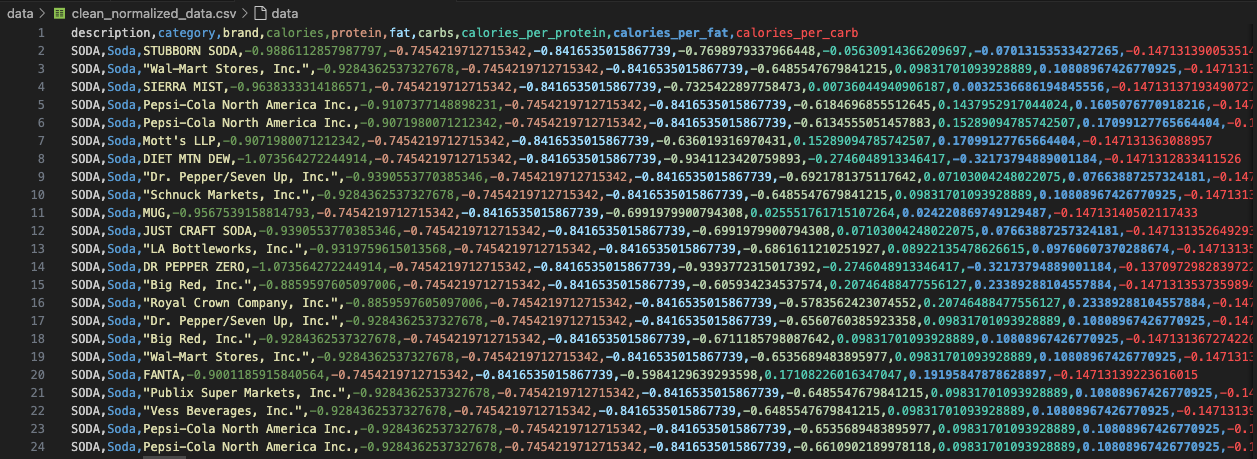
Cleaned Data
The cleaned data is now structured and ready for meaningful analysis. With missing values handled and duplicates removed, every entry is reliable and consistent. New features like calorie categories and nutrient ratios make it easier to compare and identify trends. Outliers no longer skew results, ensuring accurate insights. Now, the data is clear, organized, and optimized for drawing valuable conclusions about ultra-processed foods.
- Data Normalization: StandardScaler was used to normalize the numerical features ('Calories', 'Protein', 'Fat', and 'Carbs') for better model performance.
- Final Data Storage: The cleaned dataset was saved in CSV format for further analysis and visualization.
Exploratory Data Analysis (EDA)
Exploratory Data Analysis (EDA) is a crucial step in data science, where we examine datasets to uncover patterns, detect anomalies, and summarize key insights. In this project, EDA was carried out by creating 10 meaningful visualizations to explore trends in food composition and high-calorie foods.
All 10 visualizations can be explored in the EDA tab
Below is an image of the Python code used for EDA, focusing on analyzing high-calorie food products across different brands:
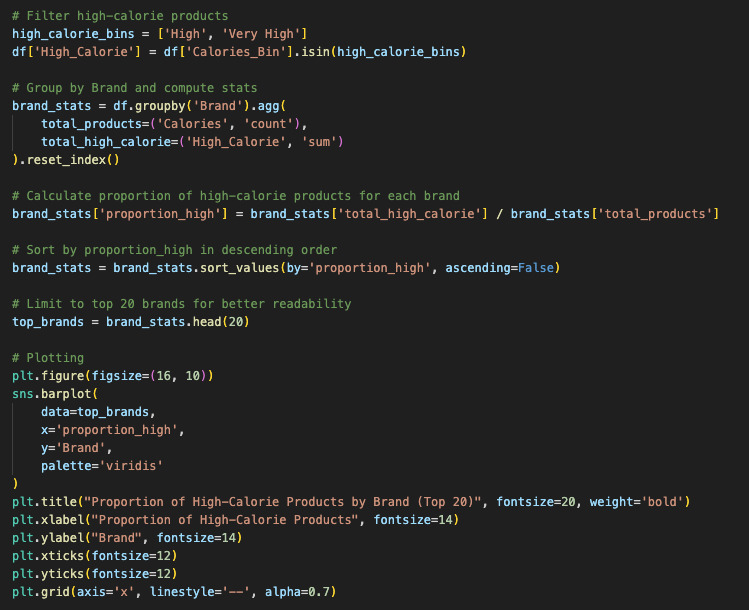
One of the key visualizations generated from EDA is the Proportion of High-Calorie Products by Brand (Top 20), which helps in understanding which brands contribute the most to high-calorie consumption.
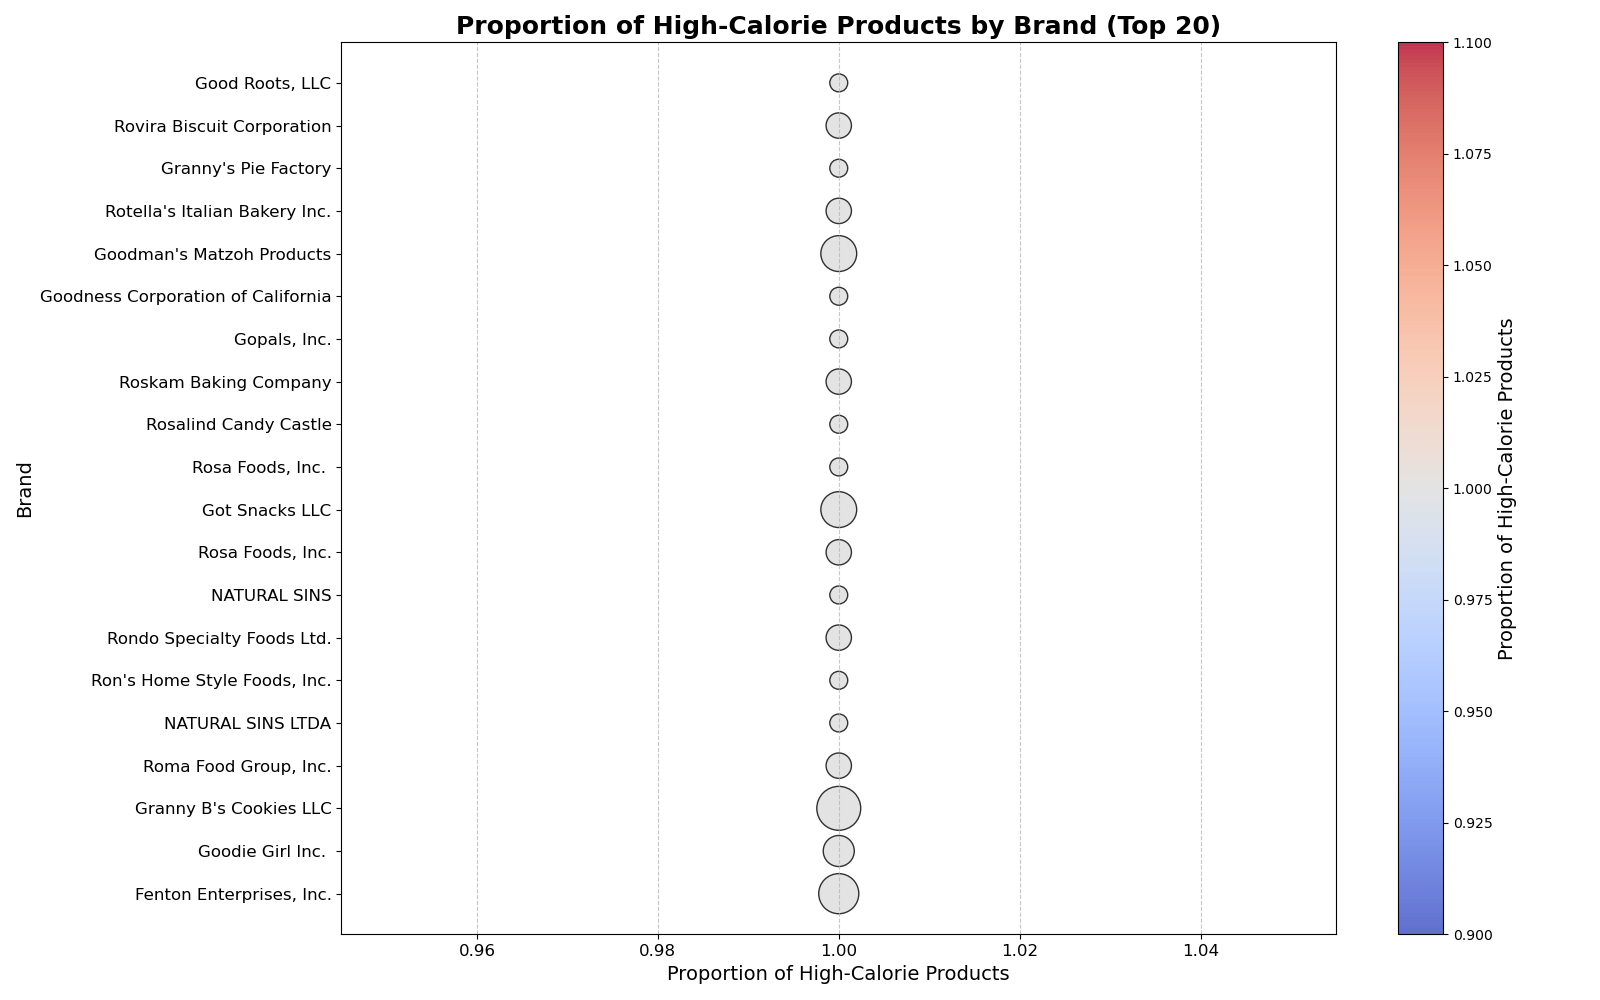
This is just one of the 10 visualizations created to uncover meaningful insights. The complete EDA process, along with the remaining visualizations, can be explored in the GitHub repository below:
Why Health Analytics Matters
Health analytics plays a pivotal role in understanding the dietary factors contributing to global health crises. By analyzing food data, we can uncover critical insights into the consumption patterns of ultra-processed foods and their association with chronic diseases like obesity, diabetes, and cardiovascular conditions. This project is driven by the belief that data-driven insights can empower individuals, policymakers, and organizations to make informed decisions, paving the way for healthier societies and improved public health outcomes.