📈 What is Linear Regression?
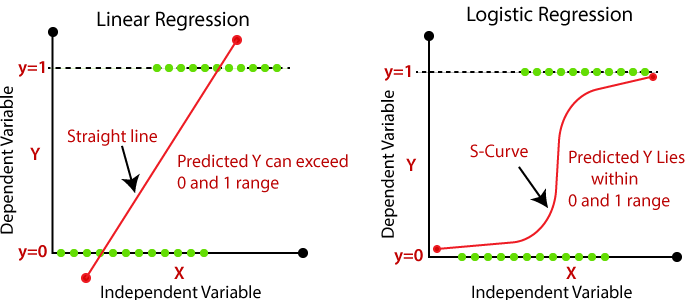
Linear regression is a fundamental statistical method used to model the relationship between a dependent variable and one or more independent variables. It assumes a linear relationship, meaning the outcome can be predicted by fitting a straight line through the data points.
The model is represented by the equation: y = β₀ + β₁x + ε, where y is the predicted value, x is the feature, and ε is the error term.
It's primarily used in regression problems—such as predicting calorie content from fat, protein, or sugar levels. In food science, this helps forecast nutrient totals or cost based on ingredients.
📉 What is Logistic Regression?
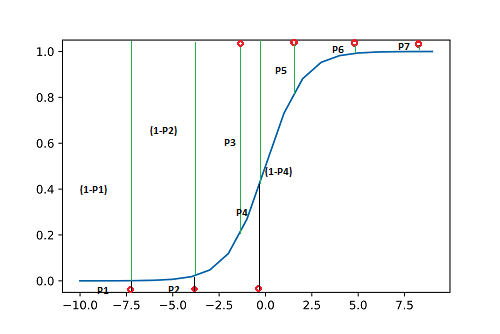
Logistic regression is used for classification problems. It predicts the probability of a sample belonging to a particular class using a logistic (sigmoid) function to transform the linear combination of inputs into a probability between 0 and 1.
The model is defined by: P(y=1) = 1 / (1 + e^-(β₀ + β₁x)). It’s widely used in food analysis to classify items as healthy/unhealthy or vegan/non-vegan based on nutritional features.
🔍 Similarities and Differences
Both linear and logistic regression use linear equations to model relationships between variables, and both estimate coefficients using optimization techniques.
However, linear regression predicts continuous outcomes, while logistic regression predicts probabilities for categorical outcomes. Logistic regression maps its output using the sigmoid function, whereas linear regression outputs raw values.
🧮 Does Logistic Regression Use the Sigmoid Function?
Yes, logistic regression uses the sigmoid function to map any real-valued number into a value between 0 and 1. This output is interpreted as the probability of the positive class.
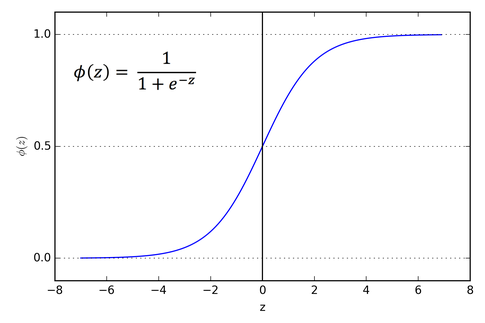
The sigmoid function is defined as: S(x) = 1 / (1 + e^(-x)). This makes it ideal for binary classification where the goal is to predict whether a food belongs to a category (e.g., "Contains Gluten": Yes/No).
📊 How is Maximum Likelihood Connected to Logistic Regression?
Logistic regression uses **Maximum Likelihood Estimation (MLE)** to find the parameters (weights) that maximize the probability of correctly classifying the training data.
Instead of minimizing squared error (like linear regression), it maximizes the log-likelihood—a measure of how likely the observed labels are, given the model predictions. This optimization enables robust probability-based classification.
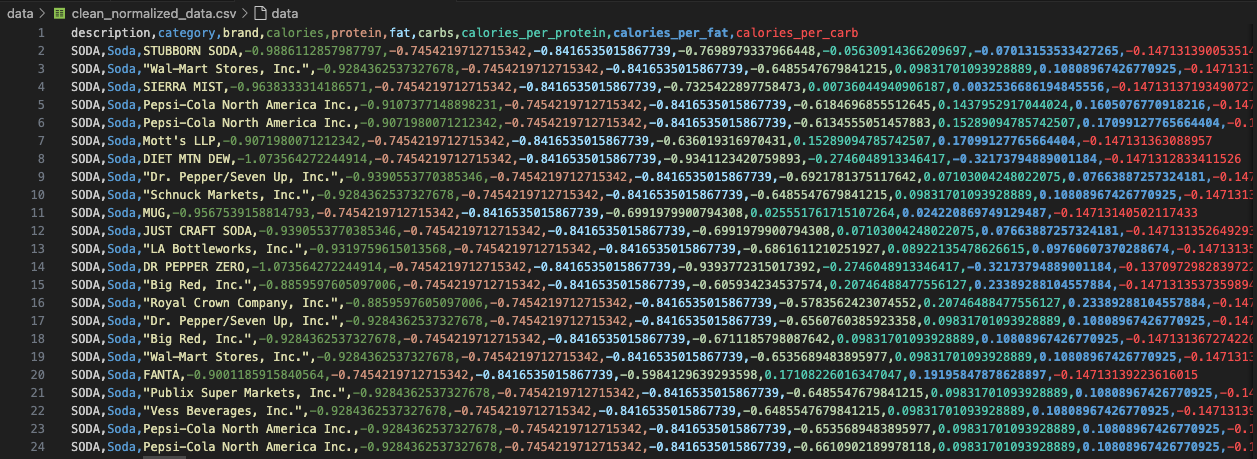
Dataset Overview
The dataset used for this binary classification task is clean_normalized_data.csv, consisting of nutritional information for thousands of food items. For this analysis, we filtered the dataset to retain only two categories: Candy and Cookies & Biscuits. These were labeled as 0 and 1 respectively, forming the basis for binary classification.
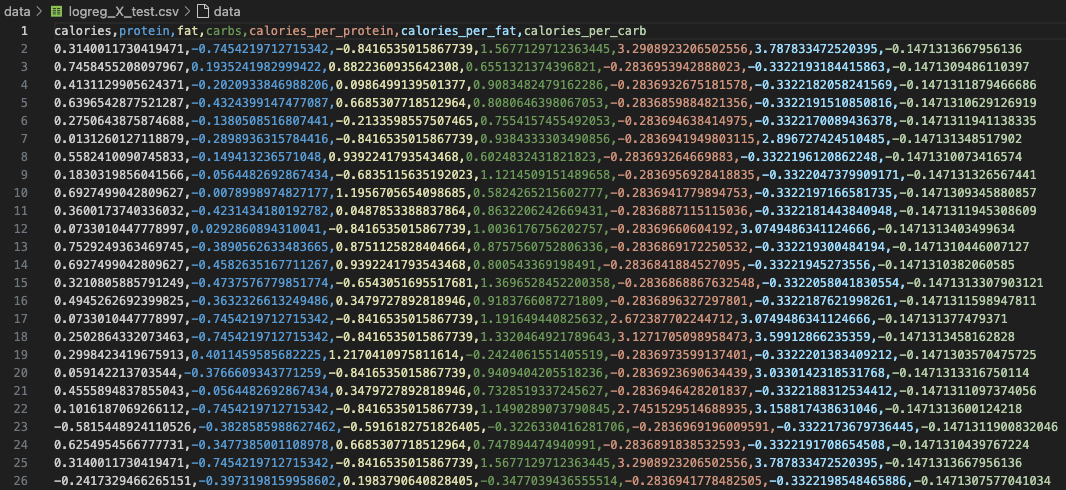
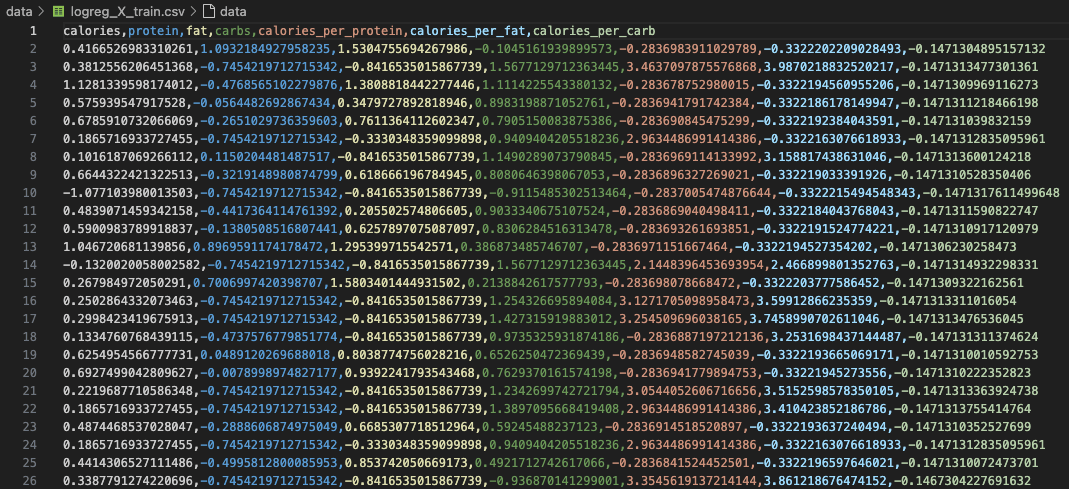
Data Preparation
Features and labels were extracted after filtering the dataset. Three columns — description, category, and brand — were dropped to retain only numeric features. The dataset was then split into training and testing sets using an 80:20 stratified split to maintain class balance.
📁 X_test: Feature matrix for evaluation
📁 X_train: Feature matrix for training
🏷️ y_test: Ground truth labels for evaluation
🏷️ y_train: Labels for training
Modeling Code
The modeling script brings together the full classification workflow using Scikit-learn — one of the most widely used Python libraries for machine learning. We implemented and compared two classic supervised learning algorithms: Logistic Regression and Multinomial Naive Bayes, specifically tailored for a binary classification task between Candy and Cookies & Biscuits.
The dataset was first split into training and testing subsets using an 80:20 stratified split to preserve class balance across both sets. The features were already normalized, but since Multinomial Naive Bayes (MNB) requires all input features to be non-negative, we applied a feature-wise shift (i.e., subtracting the minimum of each feature from all rows) before feeding it into MNB. Logistic Regression did not require any such adjustment and was trained directly on the original normalized data.
After training both models on the processed data:
- We predicted labels for the test set using each model
- Generated confusion matrices to visualize prediction vs actual performance
- Created classification reports summarizing precision, recall, F1-score, and support
- Saved visualizations as PNGs and reports as TXT files for documentation
Results & Visualizations
Logistic Regression
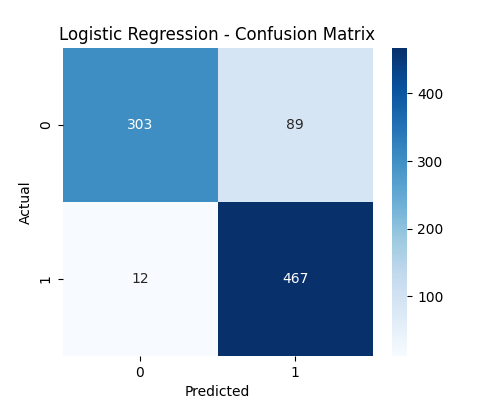
The Logistic Regression model was trained on normalized nutrient values and performed well in classifying food items as either Candy (0) or Cookies & Biscuits (1). The confusion matrix below shows that the model correctly predicted 303 out of 392 Candy items and 467 out of 479 Cookie items.
However, the model misclassified 89 Candy items as Cookies and only 12 Cookies as Candy, indicating a slight imbalance in precision for class 0. This suggests the model has a stronger tendency to predict Cookies over Candy, possibly due to overlapping nutrient profiles.
Multinomial Naive Bayes
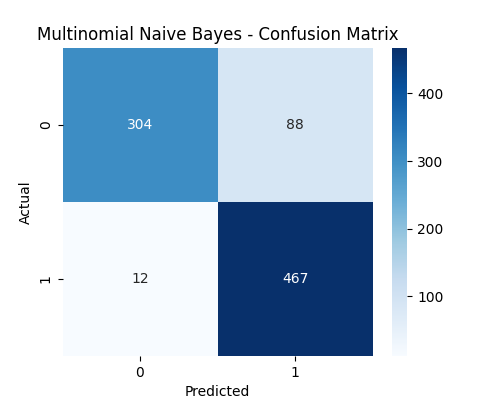
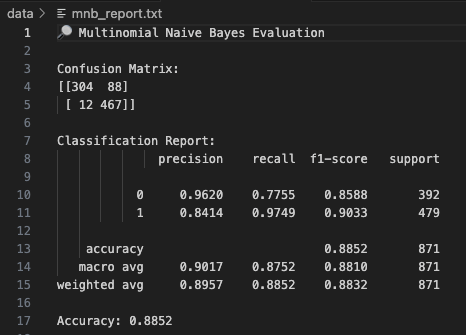
The Multinomial Naive Bayes (MNB) model was trained on the same features after applying a shift to ensure all values were positive (as required by MNB). The confusion matrix shows that MNB slightly outperforms Logistic Regression — correctly classifying 304 Candy items and 467 Cookie items, with only 12 misclassified Cookies and 88 misclassified Candies.
The classification report reveals that the model maintains strong precision and recall across both classes, achieving an overall accuracy of 88.52% compared to Logistic Regression’s 88.40%. The improvement, although marginal, highlights MNB’s effectiveness on this type of categorical data with normalized counts.
📊 Model Comparison & Interpretation
After training both Logistic Regression and Multinomial Naive Bayes (MNB) models on the same cleaned and normalized dataset, we evaluated their performance using confusion matrices, classification reports, and accuracy metrics. Both models demonstrated strong classification capabilities for distinguishing between Candy and Cookies & Biscuits based on nutrient profiles.
The Multinomial Naive Bayes model achieved an overall accuracy of 88.52%, slightly outperforming Logistic Regression, which reached 88.40%. This difference, while subtle, reflects how MNB benefits from its probabilistic structure — especially when working with nutrient data that resembles frequency or scaled count distributions. Since MNB assumes feature independence and handles skewed distributions well, it's particularly effective in nutrition-related datasets where certain macro-nutrients (e.g., carbs or fats) dominate.
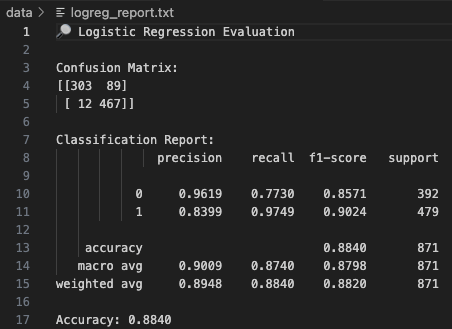
In both models, recall for class 1 (Cookies & Biscuits) was excellent (0.97), indicating the models almost always correctly identify Cookie items. However, the recall for class 0 (Candy) was notably lower, especially in Logistic Regression (0.7730) compared to MNB (0.7755). This suggests that Candy items were more likely to be misclassified, likely due to feature overlaps with other sugary items like certain biscuits or chocolate-covered snacks.
From the confusion matrices:
- Logistic Regression misclassified 89 Candy items as Cookies
- Multinomial Naive Bayes misclassified 88 Candy items
- Both models misclassified only 12 Cookie items
Overall, while Logistic Regression is known for its interpretability and stability, especially in linearly separable problems, MNB proves to be more effective here because:
- It handles high-dimensional data better
- Performs well with positively scaled normalized values
- Is less sensitive to multicollinearity and more efficient in memory
Both models have strengths, but in this specific case of binary food classification using nutrient values, Multinomial Naive Bayes offers a performance edge while maintaining simplicity and speed.
🧠 Final Conclusion & Takeaways
This section summarizes the learnings and outcomes of this binary classification task using real-world nutritional data sourced from the USDA database. Here are the key highlights:
- ✅ The dataset was successfully filtered to contain only two relevant and nutritionally distinct food categories: Candy and Cookies & Biscuits, allowing for a well-defined binary classification problem.
-
🔁 Feature preparation involved dropping non-numeric identifiers like
description,brand, andcategory, followed by normalization to ensure model compatibility and fair scaling. -
🧪 Both Logistic Regression and Multinomial Naive Bayes were implemented using
Scikit-learn. Confusion matrices and classification reports provided deep insights into precision, recall, and model confidence. - 📈 MNB showed a slight accuracy advantage and better performance in handling feature variability, making it the recommended model for future deployment in similar nutrition-centric classification tasks.
- 🔗 All visuals (confusion matrices, performance reports) and raw CSV data splits were preserved and linked through GitHub, ensuring full transparency and reproducibility of the modeling process.
In conclusion, this task exemplifies a full-cycle machine learning pipeline: from dataset curation and transformation to model selection, training, and evaluation. The project highlights the real-world value of classic models like Logistic Regression and Naive Bayes — and how they can be leveraged effectively for health and nutrition analytics.
With minimal tuning, interpretable features, and a strong understanding of model assumptions, such approaches can enable smarter food classification, better consumer health recommendations, and scalable decision-making systems in dietary tech.