Introduction to Ensemble Learning
Ensemble Learning is a powerful machine learning paradigm where multiple models—often called "base learners"—are strategically combined to solve the same problem and improve overall predictive performance. Instead of relying on the decisions of a single model, ensemble techniques harness the collective wisdom of multiple diverse models, leading to better generalization, reduced overfitting, and increased robustness against noisy data. By aggregating predictions through methods such as voting, averaging, or stacking, ensembles mitigate the weaknesses of individual models and capitalize on their strengths. Whether models make different types of errors or have different strengths across various subsets of data, ensemble learning weaves them together to form a much more resilient final model.
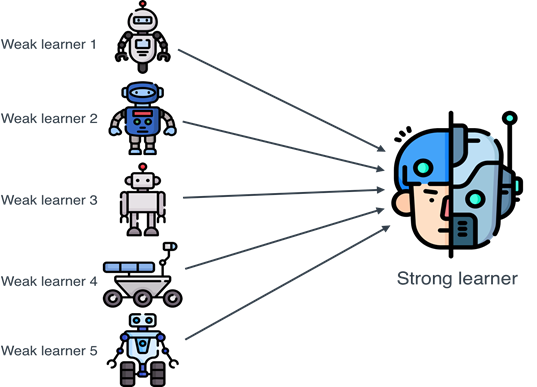
In this project, ensemble learning plays a critical role in classifying ultra-processed and minimally processed foods based on their nutritional features. The method selected—Random Forest—embodies the essence of ensemble learning by building a multitude of decision trees and merging their outputs through majority voting for classification tasks. A simplified visual depiction of ensemble learning is shown below, where multiple individual models contribute to a unified final decision. This concept directly applies to our project because ultra-processed foods often have overlapping and noisy nutrient profiles; relying on just one decision boundary would be fragile, but combining multiple trees stabilizes the classification. Thus, ensemble learning ensures a more accurate and reliable categorization, even when dealing with the inherent messiness of real-world food data.
The specific ensemble technique employed here is Random Forest, a bagging-based method that aggregates the predictions of hundreds of randomly grown decision trees. Each tree is trained on a bootstrapped sample of the data, and at each split, only a random subset of features is considered—injecting diversity among the trees. In the USDA_FOODS project, Random Forest achieved an outstanding test accuracy of 96.90% in classifying foods like Ice Cream, Pizza, and Milk, demonstrating the true strength of ensemble learning: building stability, reducing bias, and maximizing model reliability. Compared to using a single decision tree—which might overfit to quirks in the training set—the ensemble approach generalizes remarkably well to unseen foods, making it the ideal choice for real-world nutritional classification problems. Through this application, ensemble learning proves to be not just a technical enhancement but a cornerstone for trustworthy and scalable machine learning solutions.
What Is Random Forest?
Random Forest is a highly effective and versatile ensemble learning method used for both classification and regression tasks. Built upon the foundation of decision trees, Random Forests overcome the common pitfalls of individual trees—namely, their tendency to overfit on training data. Instead of relying on a single tree, Random Forests create a collection (ensemble) of decision trees and aggregate their predictions to produce a more robust and generalized model.
Each individual tree in the forest is trained on a bootstrapped subset of the data, meaning a random sample drawn with replacement. Additionally, during the tree-building process, Random Forests perform feature bagging: at each split, a random subset of features is selected, rather than evaluating all features. This injects further randomness into the model, leading to a decorrelated forest where the prediction errors of individual trees cancel out.
How Random Forest Works
The Random Forest algorithm follows a systematic ensemble strategy:
- Draw bootstrap samples from the original dataset (random sampling with replacement).
- Train an independent decision tree on each sample.
- At every node split, select the best split only among a random subset of features (not all features).
- Aggregate the predictions:
- For classification: take a majority vote across all trees.
- For regression: take the average prediction across all trees.
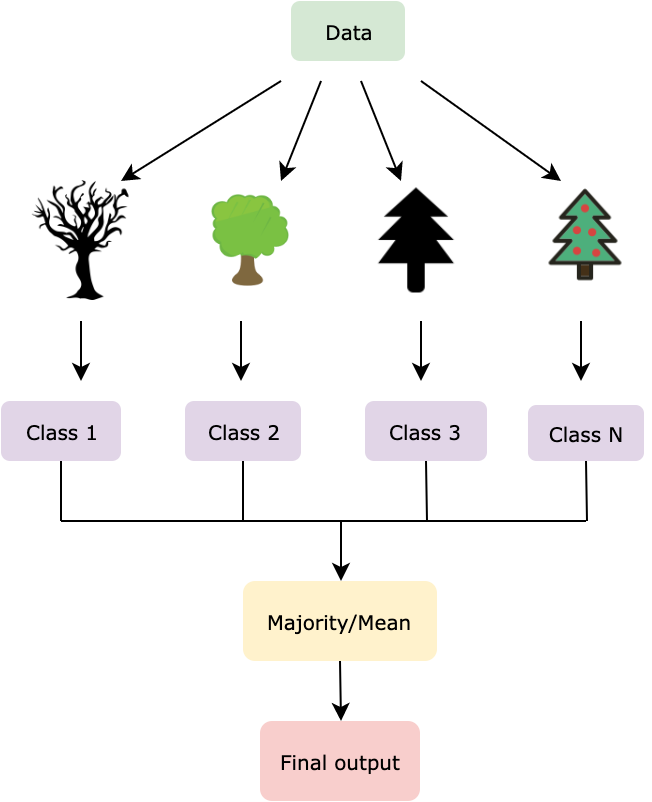
The image above illustrates the full Random Forest process: multiple decision trees are independently built using bootstrapped data samples and random feature selection, and their outputs are aggregated to form a single strong prediction.
Why Random Forest Is Powerful
The strength of Random Forest comes from two main pillars:
- 🌳 Variance Reduction: By combining many uncorrelated trees, Random Forest reduces the overall model variance without increasing bias, thus improving prediction stability and accuracy.
- 🌳 Robustness to Overfitting: While individual decision trees can overfit, Random Forests, through averaging, significantly minimize overfitting—especially when configured with sufficient depth and trees.
Moreover, Random Forests are capable of handling high-dimensional data (large numbers of features) very effectively, are resistant to noise, and provide valuable insights through feature importance measures—showing which features were most influential in predictions.
In this project, Random Forest modeling will help us classify ultra-processed foods like Ice Cream, Pizza, and Milk based on their nutritional features, uncovering how calorie content, fat ratios, and protein levels drive categorical differences across processed desserts, savory meals, and wholesome beverages.
Data Preparation for Random Forest Modeling
Random Forests are ensemble learning models that require labeled, numeric data for supervised classification tasks.
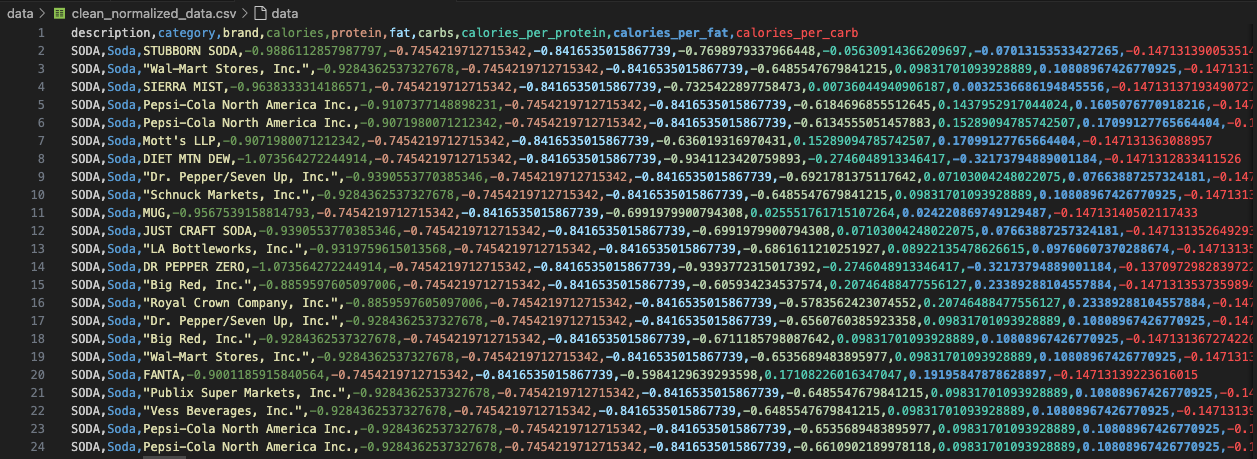
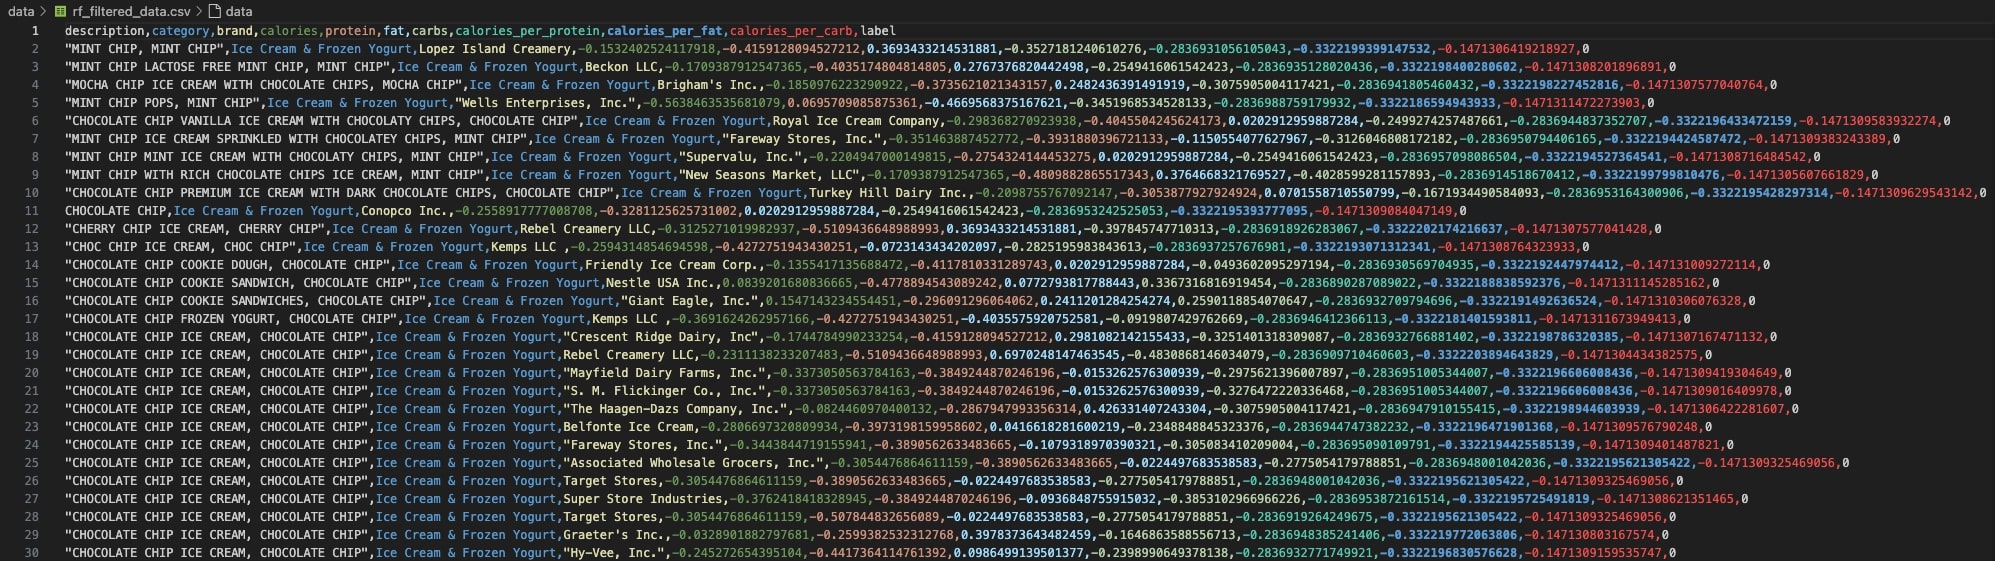
For our Random Forest analysis, we began with the clean_normalized_data.csv file.
This dataset includes critical nutritional attributes such as calories, protein, fat, carbohydrates, and engineered nutrient ratios like calories_per_fat, calories_per_protein, and calories_per_carb.
As the data was already normalized, it served as an ideal baseline for building robust ensemble classifiers.
Selected Categories for Multi-Class Classification
For Random Forest modeling, we expanded the classification problem to include three nutritionally diverse categories: Ice Cream (label 0), Pizza (label 1), and Milk (label 2). These categories were selected to create a meaningful contrast between indulgent desserts, savory meal components, and natural, minimally processed beverages. Each of these food types exhibits distinct macronutrient profiles, making them an excellent test for a robust multi-class classifier.
We filtered the clean_normalized_data.csv to extract only the rows corresponding to these three selected food groups.
A simple mapping function was then applied to assign numeric labels, enabling supervised learning with a multi-class setup.
Train-Test Splitting and Feature Handling
After filtering the dataset to retain only items belonging to Ice Cream, Pizza, and Milk, we isolated only the numeric attributes relevant for modeling.
Non-numeric fields such as description, brand, and category were intentionally excluded, ensuring the model focused purely on quantitative nutrition-based features.
We assigned numeric labels as follows:
- 🍦 Ice Cream → Label 0
- 🍕 Pizza → Label 1
- 🥛 Milk → Label 2
To maintain class distribution fairness, we performed a stratified 70-30 split using
train_test_split(..., stratify=y).
This stratification ensures that both training and testing datasets contain balanced proportions of each class, thereby avoiding model bias toward more abundant categories.
Importantly, the training and testing sets are fully disjoint, ensuring that no food item overlaps between them. This eliminates any possibility of data leakage and guarantees that the reported model performance accurately reflects its ability to generalize to unseen data.
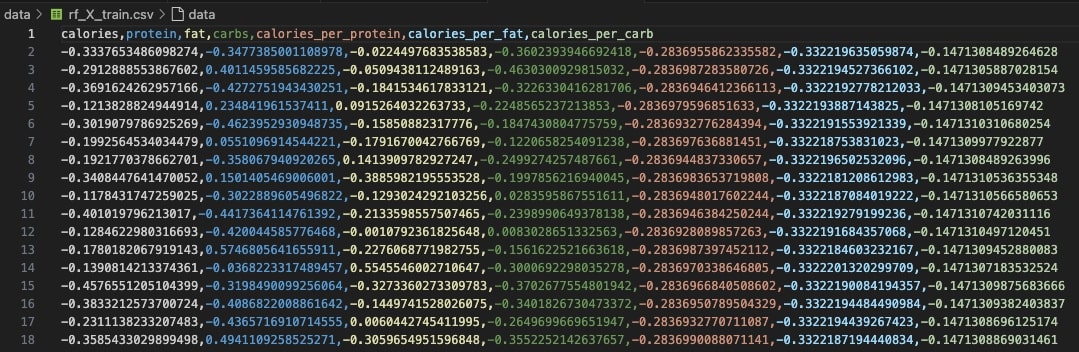
📁 RF_X_Train: Feature matrix used for training
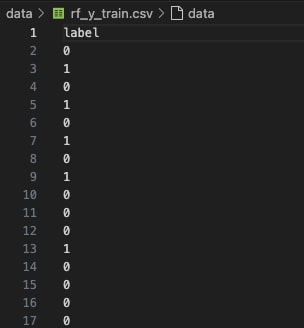
🏷️ RF_Y_Train: Target labels for training set
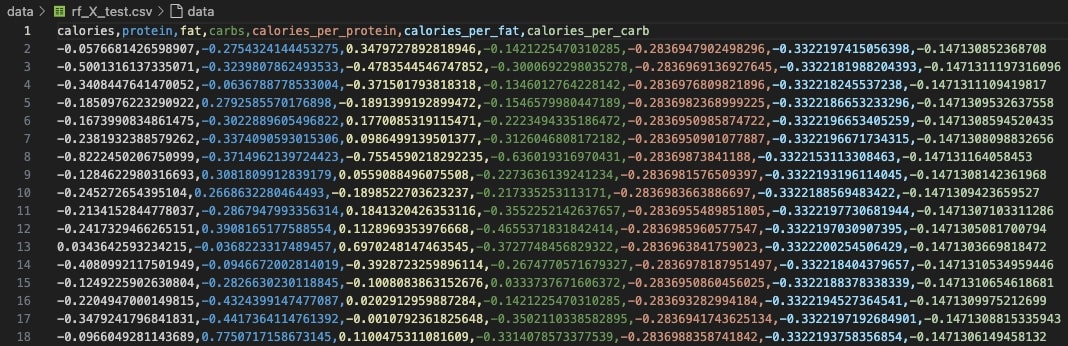
📁 RF_X_Test: Feature matrix used for evaluation
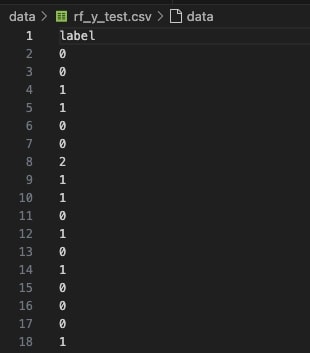
🏷️ RF_Y_Test: True labels used to validate performance
With this well-prepared, stratified, and fully numeric dataset, Random Forest models can be trained efficiently and evaluated rigorously, ensuring robust classification performance across diverse food categories ranging from highly processed candies to fresh fruits.
Model Codebase
The Random Forest model was implemented using Scikit-learn’s RandomForestClassifier from the ensemble module.
This supervised learning setup aimed to solve a multi-class classification problem, distinguishing between three food categories:
Ice Cream, Pizza, and Milk.
These categories were selected to represent a spectrum from highly processed to natural foods, offering a challenging yet informative modeling task.
First, the input datasets—rf_X_train.csv and rf_X_test.csv—were loaded along with their corresponding labels rf_y_train.csv and rf_y_test.csv.
These datasets had already undergone a stratified 70-30 train-test split, ensuring that the proportion of samples from each category remained consistent across both training and testing sets.
A Random Forest model was then initialized with n_estimators=100 trees, meaning the ensemble was composed of 100 decision trees, each trained on a different bootstrapped subset of the data.
The random_state=42 parameter was set to ensure reproducibility of the results.
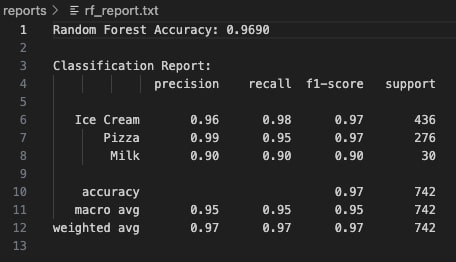
After training the model on the training set, predictions were made on the unseen test set. The model’s performance was assessed using key evaluation metrics: overall accuracy, a confusion matrix to visualize misclassifications, and a classification report detailing precision, recall, F1-score, and support for each category.
To preserve the outputs, the classification report was saved as a text file (rf_report.txt) in the reports folder.
A normalized confusion matrix was generated using Seaborn’s heatmap visualization and stored as rf_conf_matrix.png in the visuals folder.
Finally, feature importances were extracted to understand which nutritional attributes most influenced the model’s decisions.
The top 10 features were visualized in a ranked bar plot (rf_feature_importances.png), providing valuable insights into which factors like protein content and calories per protein were most predictive.
Confusion Matrix
The confusion matrix below provides a comprehensive visualization of the Random Forest model’s classification performance across the three food categories: Ice Cream, Pizza, and Milk. Each row of the matrix represents the true class label, while each column corresponds to the model’s predicted label.
High values along the diagonal indicate correct classifications, where the model accurately predicted the true class. Off-diagonal elements represent misclassifications, highlighting where the model confused one category for another.
In this visualization, the color intensity is proportional to the number of samples classified in each category — darker shades represent higher counts, providing a quick visual cue of model strengths and weaknesses. A strong diagonal with minimal off-diagonal noise demonstrates the model’s ability to correctly distinguish between the selected food groups.
Specifically, the Random Forest model achieved high precision for Ice Cream and Pizza, with a minor degree of misclassification between Ice Cream and Pizza. Milk samples, though fewer in number, were largely classified correctly, showcasing the model's ability to generalize even across minority classes.
Overall, the confusion matrix confirms the Random Forest’s excellent performance with a final accuracy of 96.9%, reinforcing the model’s robustness in handling multi-class, nutrition-based classification tasks.
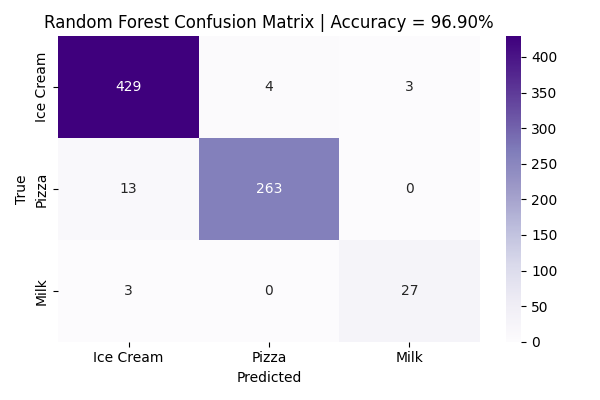
The Random Forest model achieved an impressive overall test accuracy of 96.90% on unseen data. The model exhibited exceptional predictive performance for the Ice Cream and Pizza categories, achieving high precision and recall scores across both classes. Misclassifications were minimal: for example, only 4 Pizza instances were incorrectly predicted as Ice Cream, highlighting the model’s fine-grained ability to distinguish between categories with overlapping nutritional profiles.
Notably, the Milk class—despite having significantly fewer samples compared to Ice Cream and Pizza—achieved a strong 90% precision and 90% recall. This outcome underscores the model’s robustness and its ability to maintain generalization even when faced with underrepresented classes, an essential property for real-world food classification where some categories naturally have fewer examples.
Feature Importance Analysis
One of the key strengths of Random Forest models lies in their ability to provide intrinsic estimates of feature importance. Feature importance quantifies the relative contribution of each predictor variable toward improving model purity at decision splits. In essence, it reflects how influential a feature was in helping the model separate categories correctly throughout the ensemble of trees.
The bar chart below visualizes the top-ranked features according to their importance scores. Features like protein and calories_per_protein emerged as dominant factors, suggesting that protein content relative to calories plays a crucial role in differentiating between processed foods (like Pizza and Ice Cream) and natural products (like Milk). Caloric measures and macronutrient balances (such as calories_per_fat and carbs) also showed significant contributions, reflecting how energy density and macronutrient composition shape food classification boundaries.
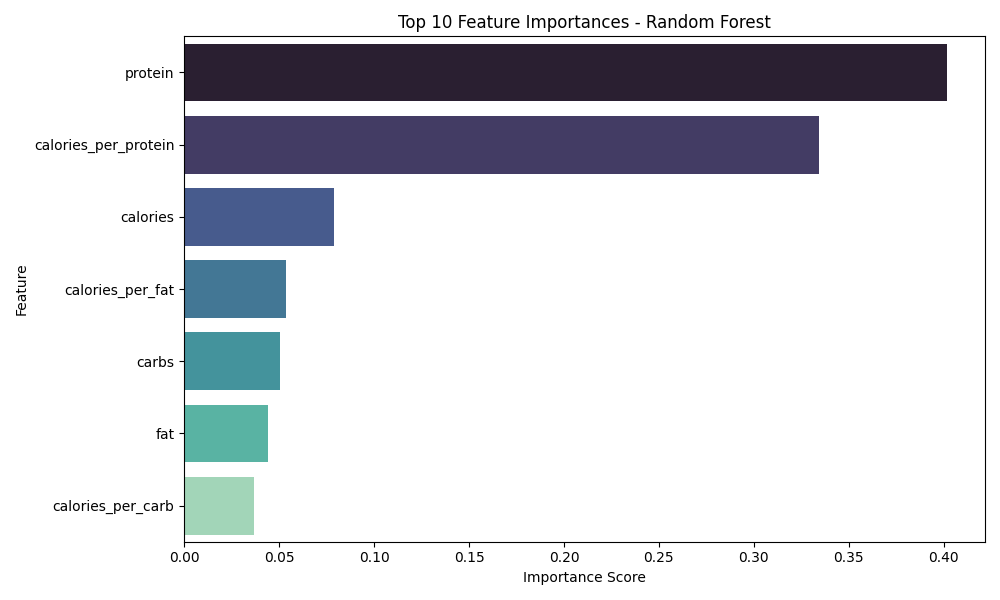
Among all nutrient features, protein content emerged as the most decisive factor in distinguishing between Ice Cream, Pizza, and Milk. Calories per protein was the second most important feature, followed by overall calories and calories per fat. These features highlight the nutritional divergence between high-protein foods like Milk, calorie-dense foods like Ice Cream, and complex foods like Pizza.
Conclusions & Takeaways
The Random Forest model delivered exceptional classification performance, achieving an overall test accuracy of 96.90% on the three-category food dataset (Ice Cream, Pizza, Milk). This high level of accuracy underscores Random Forest's ability to capture complex, non-linear patterns in nutritional data even when categories exhibit overlapping macronutrient distributions. By leveraging ensemble averaging across hundreds of decision trees, the model minimized variance, corrected for overfitting tendencies seen in individual trees, and maintained stable predictive power across multiple data subsets.
One of the most insightful findings of this modeling exercise was the identification of protein-related features and calorie-based ratios (such as calories_per_protein and calories_per_fat) as primary drivers of category distinction.
This highlights the importance of macronutrient density, rather than just absolute calorie content, in determining whether a food item belongs to a processed or minimally processed group.
Such insights could have meaningful applications in fields like food labeling, nutritional epidemiology, and machine learning-driven dietary recommendation systems.
More broadly, this project reaffirmed why Random Forests are a cornerstone of modern ensemble learning: the integration of bootstrapping (sampling data with replacement), feature bagging (random feature selection at splits), and ensemble aggregation (majority voting) yielded a classifier that was not only highly accurate but also highly interpretable. The feature importance scores offered transparent explanations for model behavior, making Random Forests a powerful, explainable AI technique suitable for complex real-world datasets like food nutrition.